

|
|
|


Excel Quality Tools
XBar-R Diagram

Statistical Process Control is an evolved form of target value steering. Partly you steer toward a target value, but also with the help of systematically performed sampling into a control chart.
It is this control chart which helps us make the right decision when we adjust the machinery or the process. The SPC - control chart file is a simple concept for helping operators to manage their work process.
Functional Scope
- up to 45 samplings
- 3 to 8 parts per sampling
- automatic calculation of the control limits (based on Rbar or Xbar)
- average value adjustment possible
- also calculate the Cpk value
XBar-R Diagram "Datasheet" - Sheet
Target value, tolerance specifications, measurements and other information to be fed in this data sheet.
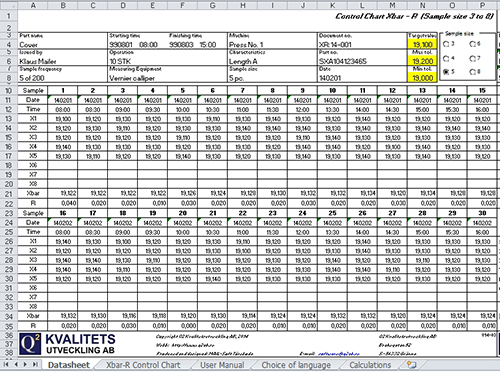
Capability parameter cpk calculated by using variation width and averages within the extracted samples.

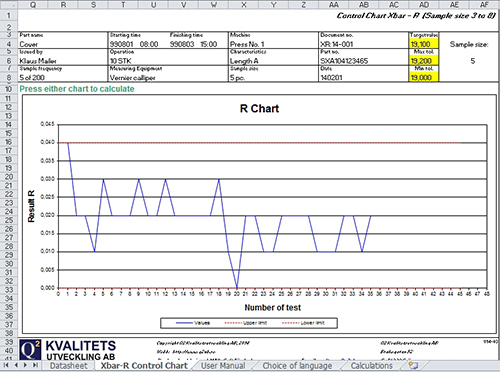
XBar-R Diagram "Control Chart" - Sheet
The results of the SPC analyse is shown in two charts:
Xbar diagram (shows the average value of the extracted samples)
R diagram (shows the range of variation in the extracted samples)
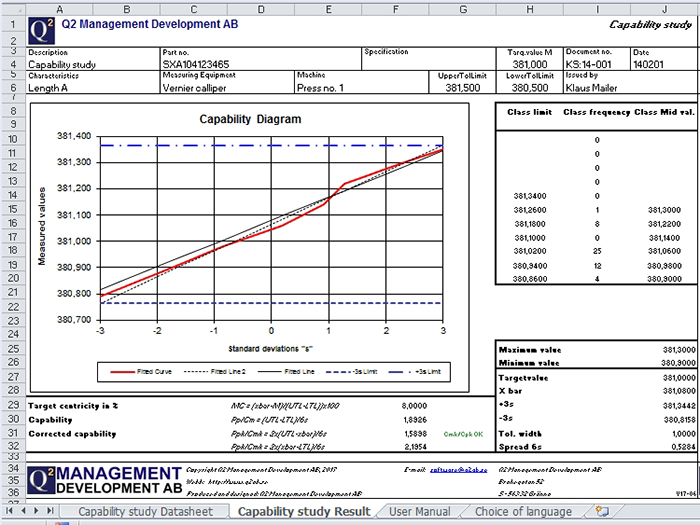
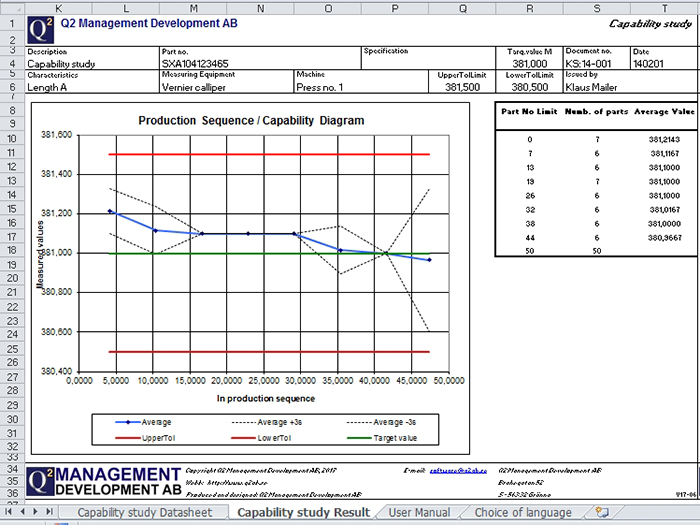
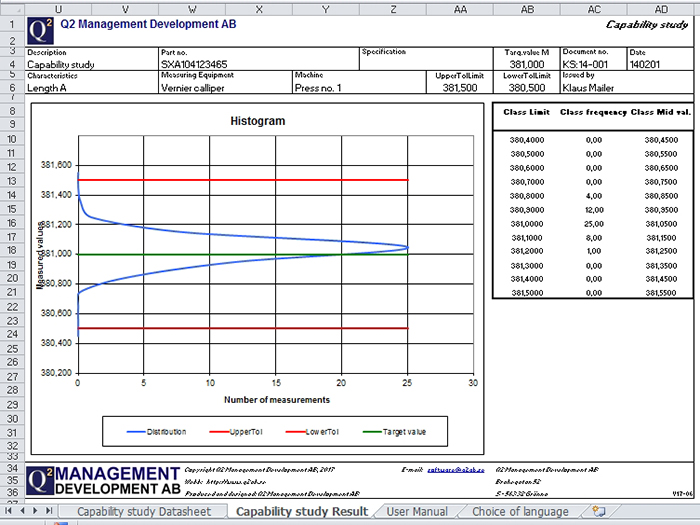
XBar-R Diagram "Result" - Sheet
The results of the capability study is displayed in three different graphs:
Capability diagram (showing whether the result is normally distributed and all calculated capability parameters foreseeable in a table)
Production sequence (showing the change in results during production)
Histogram (showing the position against tolerance limits)
Price
The price for the tool Xbar-R Diagram is 2.000 SEK excl. VAT.
Ordering
To order Excel Quality Tools please use the
electronic order form.
The copyright of the Excel files is owned by Q2 Management Development AB. It is impermissible
to copy, modify, distribute, promote or sell multiple or single files, unless written
permission has been given from Q2 Management Development AB.
The Excel files are designed and developed by Q2 Management Development AB.
Q2 Management Development ABBrahegatan 52
|
Here we are |
Links |
Copyright © Q2 Management Development AB - Updated 2022